
LiveOps Benchmarks: Top Casual Hits Now Run 97 Events a Month
Did you know race mechanics headline 70% of the charts? Steal these LiveOps benchmarks, 358#

Hey Friends, Greetings from Bangalore 💗
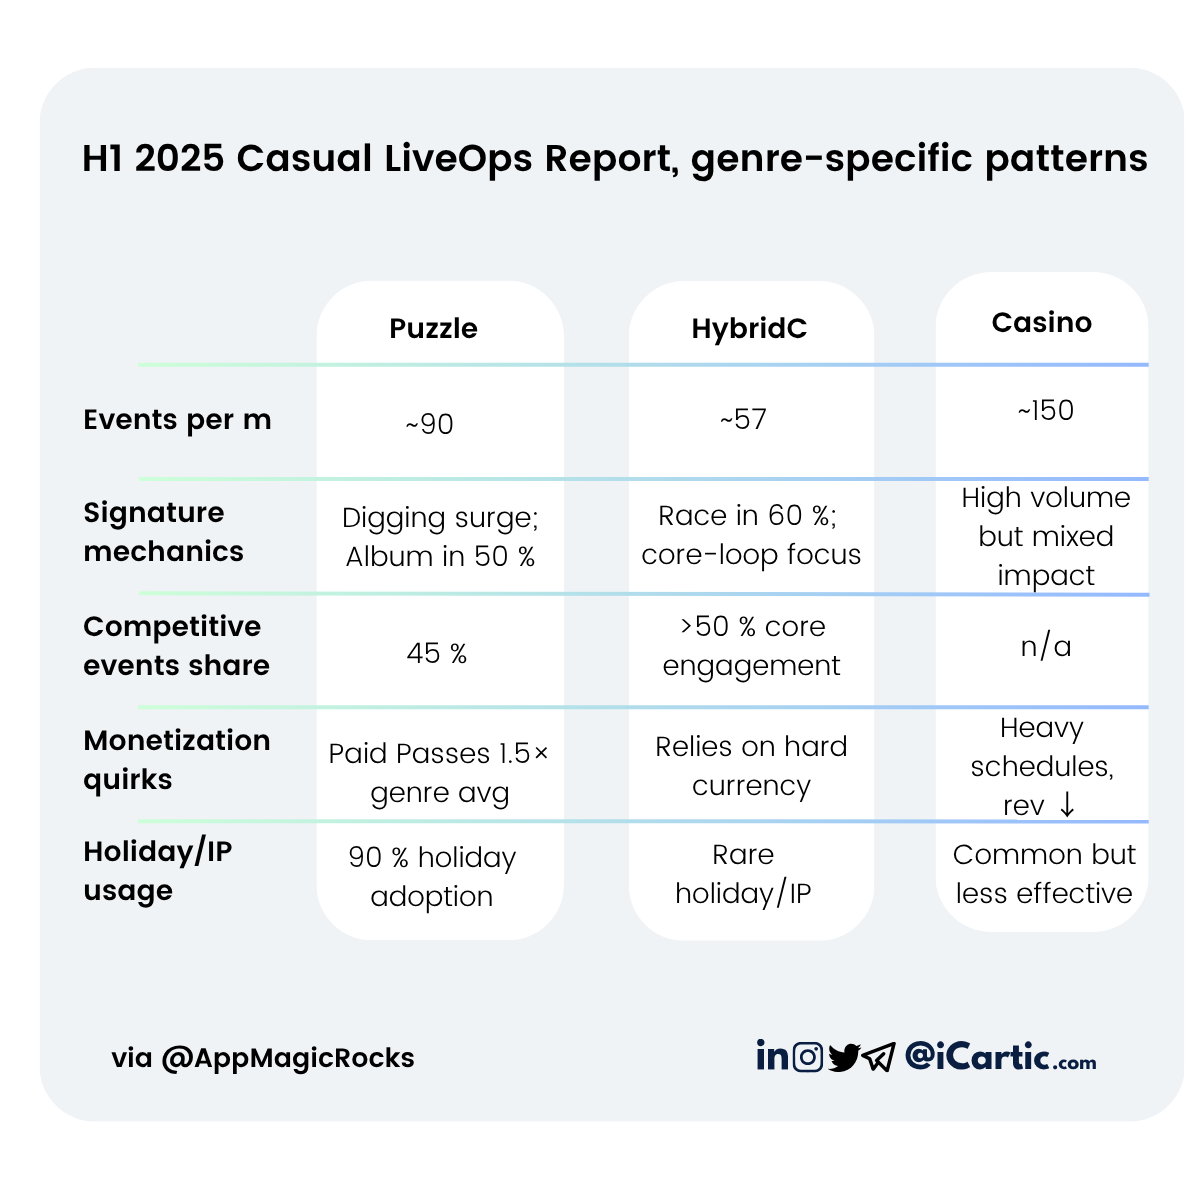
H1 2025 Casual LiveOps Report.
Market Snapshot:
1. Global performance: Revenue ↑ 3.6 % YoY; downloads ↑ 6 %
2. Genre winners & losers: Puzzle revenue ↑ 13.2 %; Hyper-casual IAP revenue ↑ 111 % (from deeper meta monetisation); Casino revenue ↓ 15.5 %
3. Staying power: Almost half of today’s top casual games shipped 2015-2020; only 11 % of 2023-25 launches broke through
LiveOps Fundamentals:
1. Event volume: Top games now average 97 events per month—a 10 % lift from Q1 to Q2.
2. Fresh content cadence: 82 % of titles introduced at least one brand-new event in H1 2025.
3. Seasonality & IP: 96 % of games ran at least one holiday event; 25 % executed an external IP collaboration.
4. Top mechanics: Race events appear in 70 % of leading games; Digging is gaining ground at 43 %.
Monetisation & Player Motivation Shifts:
1. Competitive-leaning events dominated early 2025 but collection & customization themes gained traction mid-year.
2. “Sale” events doubled share (6 % → 10 %); hard-currency offers rose from 15 % to 20 %.
3. LiveOps is increasingly calibrated to existing payers rather than new-user funnels.
Use these insights to benchmark cadence, mechanic mix, and monetisation focus against your own roadmap—and decide where to push volume versus refine quality.
tCARe, CARtic P
/ iCartic.com